Data is powerful — but only when people understand it. Transform Your Website Data Into Visual Stories Using Dynamic Blocks for Gutenberg
Most website visitors won’t read long tables, complex reports, or spreadsheets.
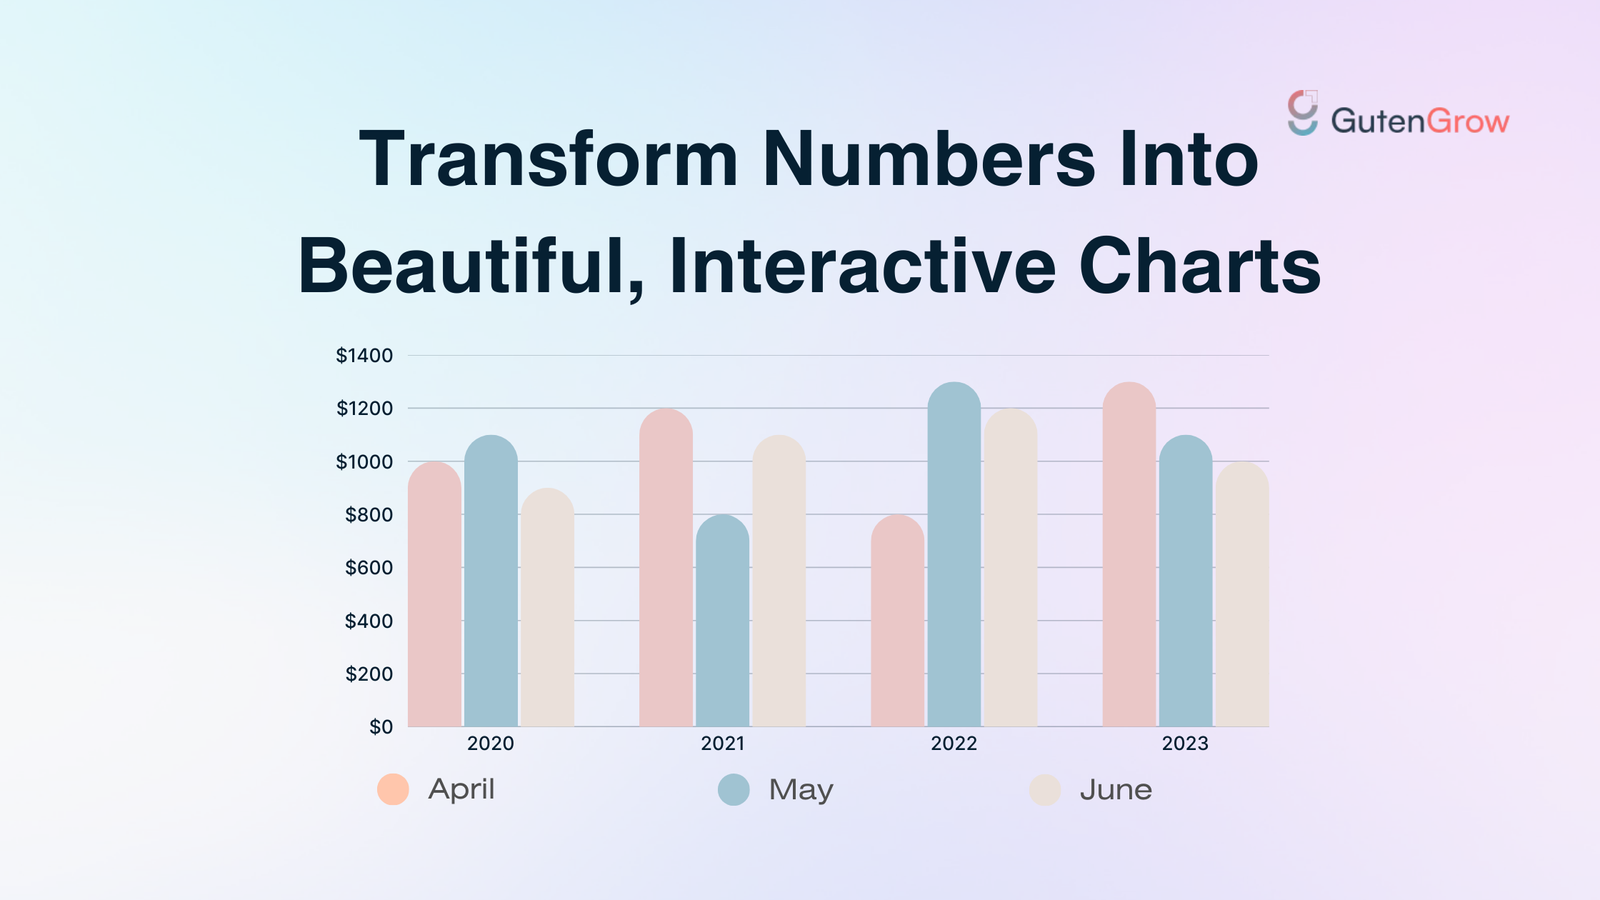
But a simple, interactive chart?
That grabs attention instantly.
Whether you’re a marketer, educator, SaaS founder, agency owner, or blogger, visualizing data is one of the easiest ways to build trust, improve clarity, and increase engagement. That’s exactly where Dynamic Chart Blocks help you turn static information into visual stories your audience can understand at a glance.
Why Data Visualization Matters More Than Ever
In today’s digital world, users decide within seconds whether your content is valuable.
A Dynamic Chart Block for Gutenberg does three powerful things:
1️⃣ Makes Information Instantly Understandable
Humans process visuals faster than text — charts remove confusion and deliver clarity.
2️⃣ Builds Trust and Authority
Clear data representation signals professionalism and transparency.
Businesses using visual data appear more credible.
3️⃣ Keeps Users Engaged Longer
Interactive elements increase time-on-page, helping with SEO and user experience.
4️⃣ Helps You Present Results, Trends, or Comparisons Effortlessly
Whether it’s growth charts, survey results, pricing comparisons, performance metrics, or analytics — charts simplify storytelling.
Why Dynamic Blocks for Gutenberg Change the Game
Most chart tools are either:
❌ Too technical
❌ Require coding
❌ Hard to update
❌ Limited in customization
Dynamic Chart Blocks solve all of that with:
✔ Drag-and-drop simplicity
✔ Clean, modern visual styles
✔ Real-time customization
✔ Multiple chart types (bar, pie, line, doughnut & more)
✔ Mobile responsiveness
✔ Zero coding needed
You don’t have to be a designer or a data expert — the block handles everything for you.
Here’s How Easy It Is to Use (Video Tutorial)
Watch the step-by-step guide here:
👉 YouTube Link: Dynamic Chart Block for Gutenberg
In this video, you’ll learn how to:
- Add Dynamic Chart Blocks to any page
- Input your data
- Customize colors, labels, and chart types
- Publish instantly
- Create multiple charts in seconds
Perfect for beginners and professionals alike.
Real Benefits for Your Website or Business
✔ Show Your Numbers Without Confusion
Instead of long explanations, charts instantly communicate performance and insights.
✔ Upgrade the Look & Feel of Your Content
Even simple charts make your pages look premium and polished.
✔ Improve Client Reports & Case Studies
If you’re an agency, freelancer, or consultant – visual charts make your results stand out.
✔ Make Learning & Data Presentation Fun
For educators and trainers, charts turn boring data into engaging visuals.
✔ Boost Conversions Through Clarity
The easier people understand your message, the more likely they are to trust and take action.
Final Thought
You’re not just adding a chart to your website —
You’re transforming raw data into stories people understand, remember, and trust.
Dynamic Chart Blocks make that easier than ever.
👉 Try it on your next blog, report, landing page, or presentation.
Your data deserves to be seen — not hidden in spreadsheets.